Financial visualization

See where the money is going

Rotation, capital flow, global liquidity, and company money flow, each in one chart you can read at a glance.

Product demo

See the chart example

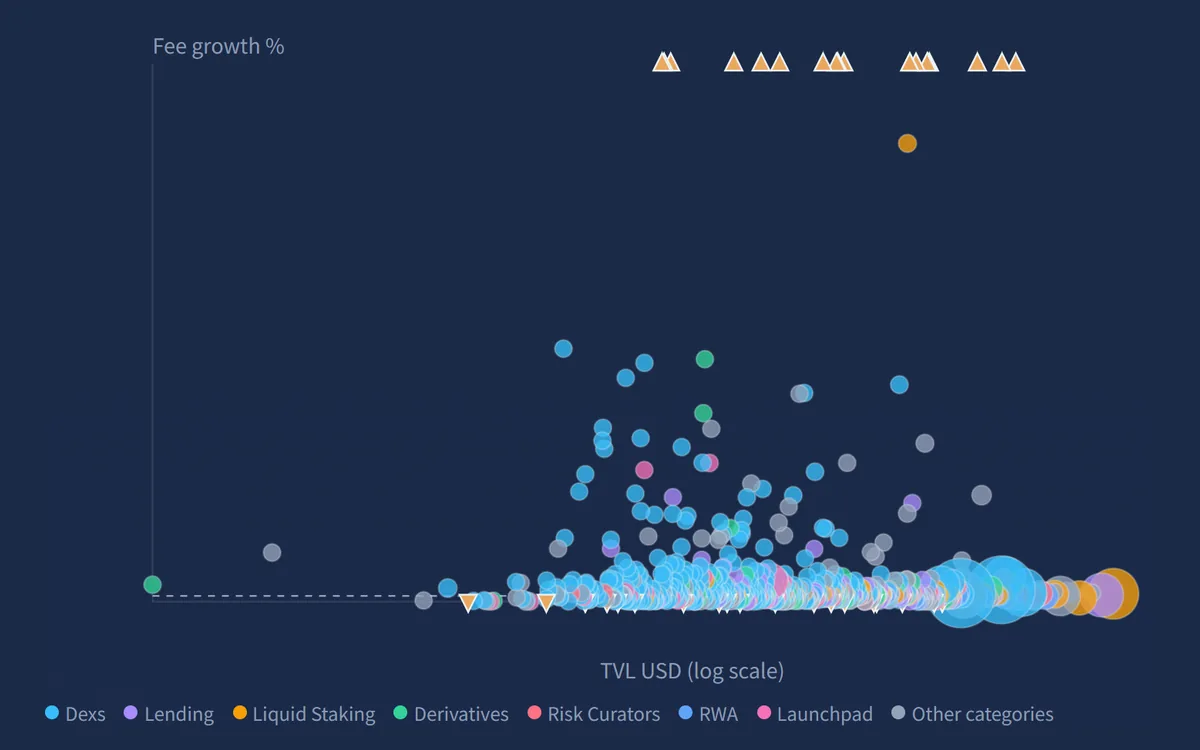
Feature illustration, not live market data

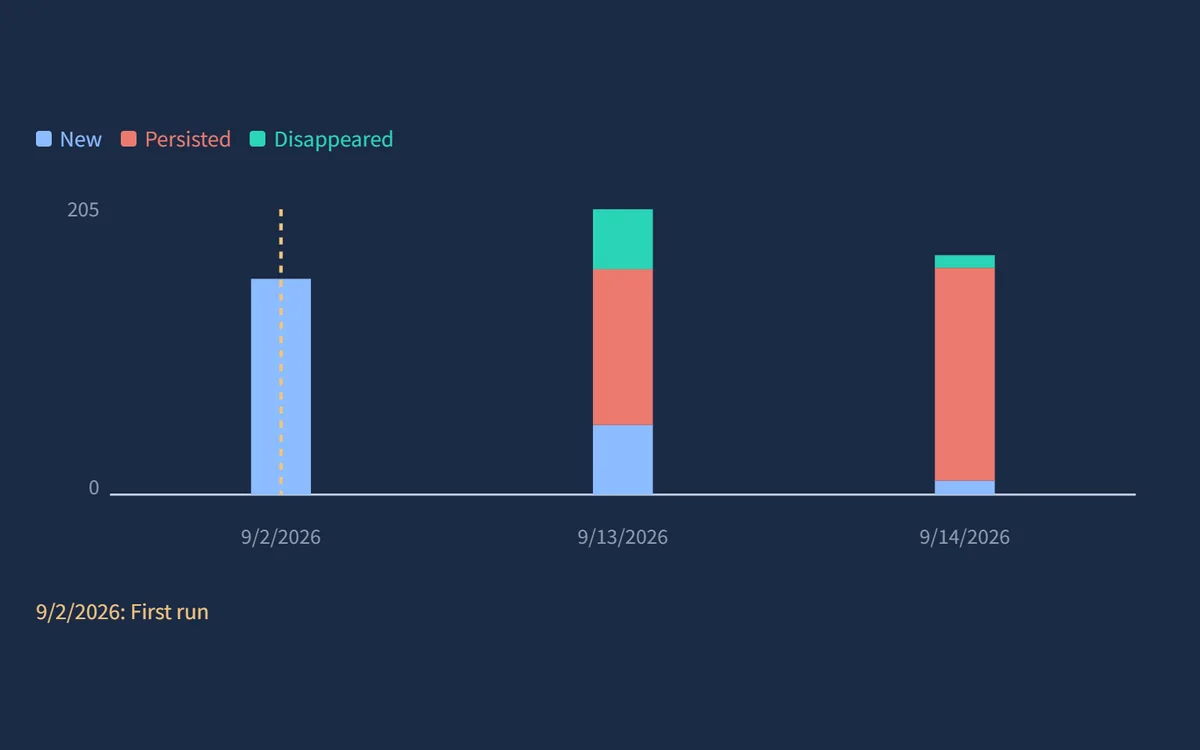
Feature illustration, not live market data

Charts: observe capital and themes

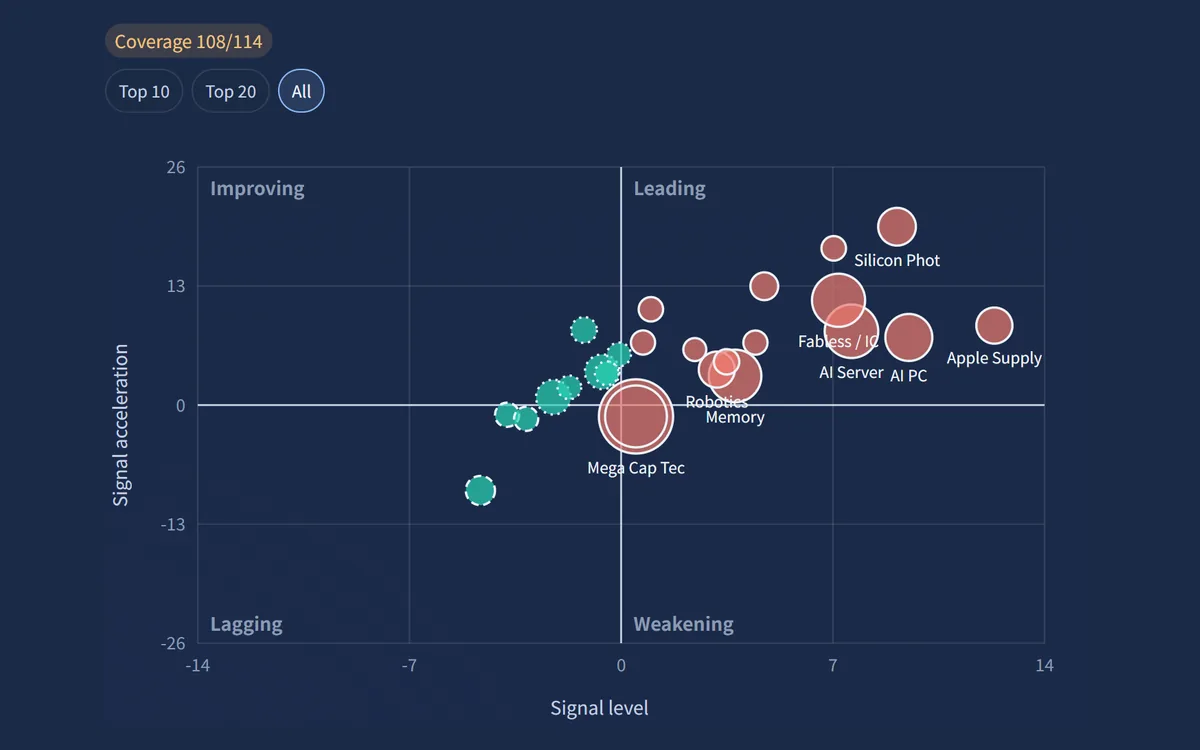
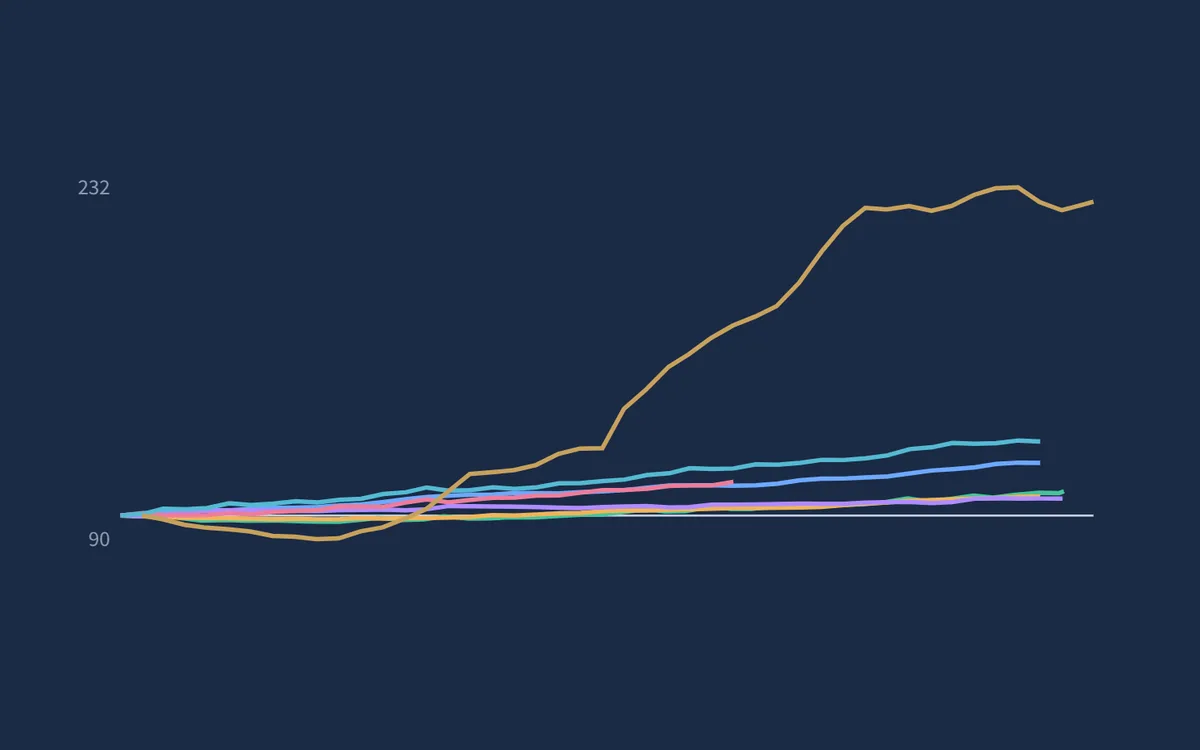
Compare four themes from Sep 04 to Sep 11: moving up and right means strengthening, down and left means weakening.

View the rotation map

Sep 04Sep 11

The charts

Free to use

The latest data on every chart is free. Sign in to add scan evolution and watchlist risk. Charts update every trading day, financials every quarter, and liquidity every month.

See more with Pro

  • Rotation mapPro

    Replay history, pick any date, switch between foreign, trust, and dealer flows, and see theme member details.

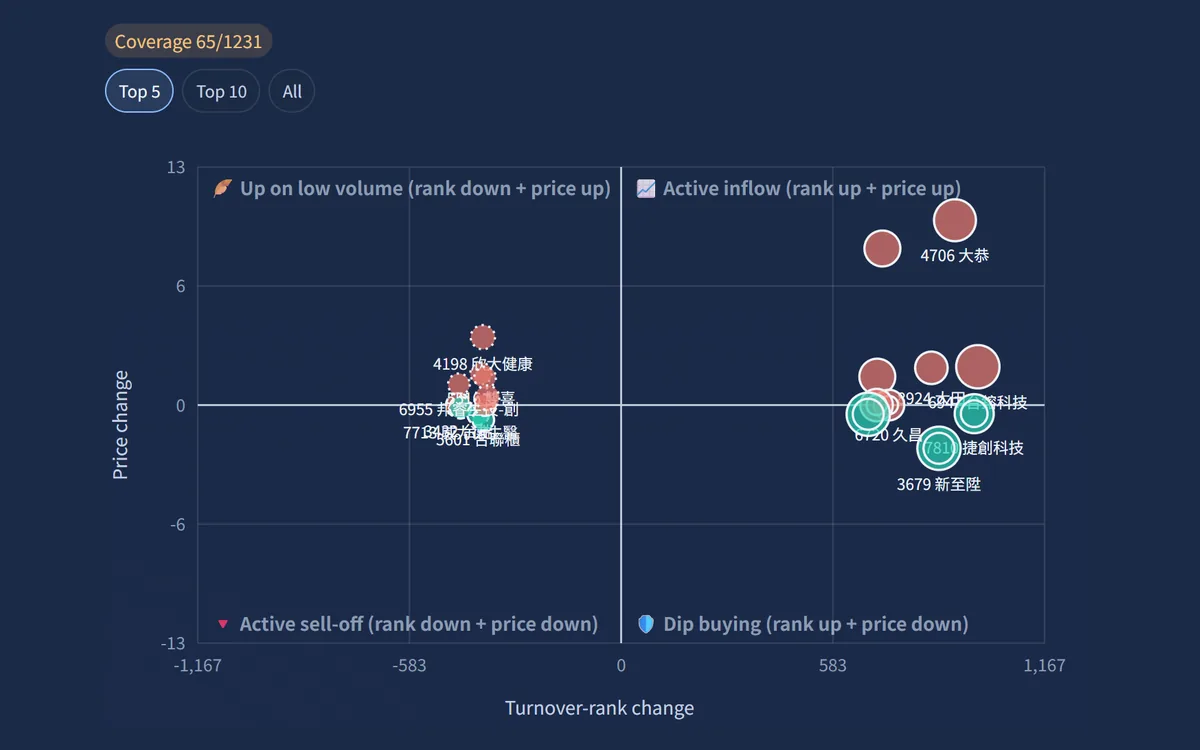
  • Capital-flow quadrantPro

    Look back at past dates and expand the stocks in each quadrant.

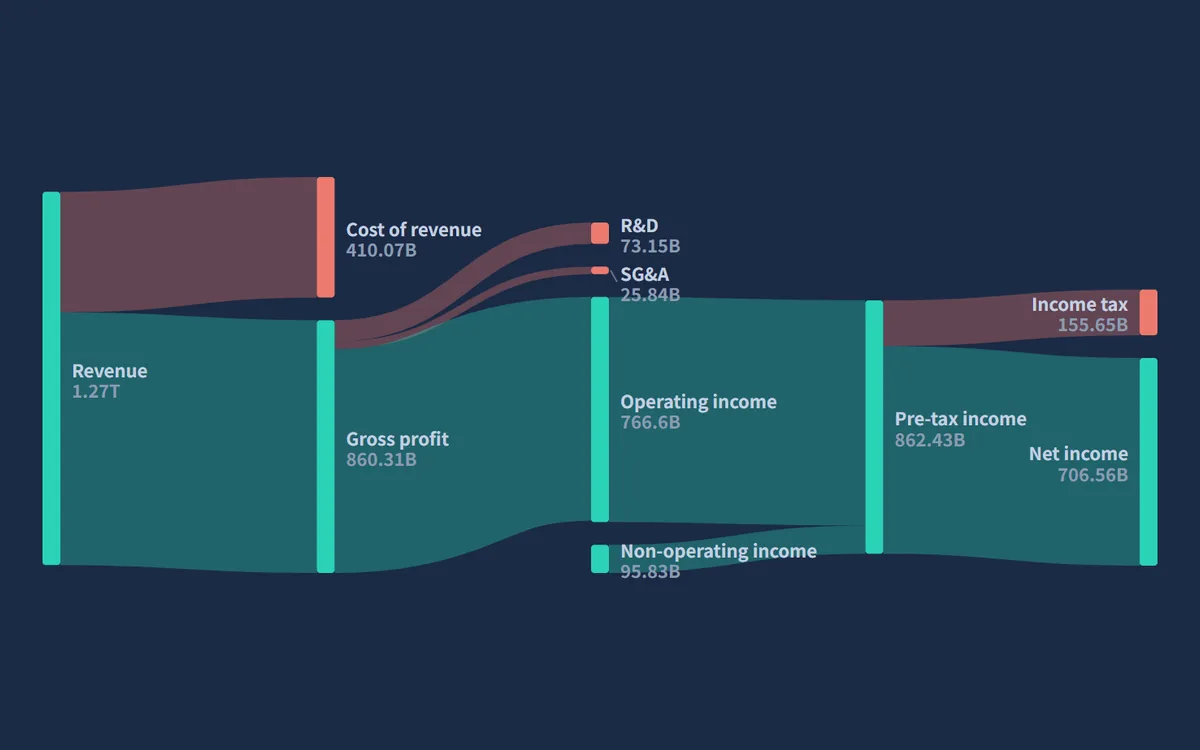
  • Financial money-flow chartPro

    Every level broken down; the free version previews through level 2.

  • On-chain efficiencyPro

    Multi-day trends, not just the latest day.

  • Stock price chartsPro

    Where your scanner conditions were met, marked on the candles.