Feature illustration, not live market data
Charts: observe capital and themes
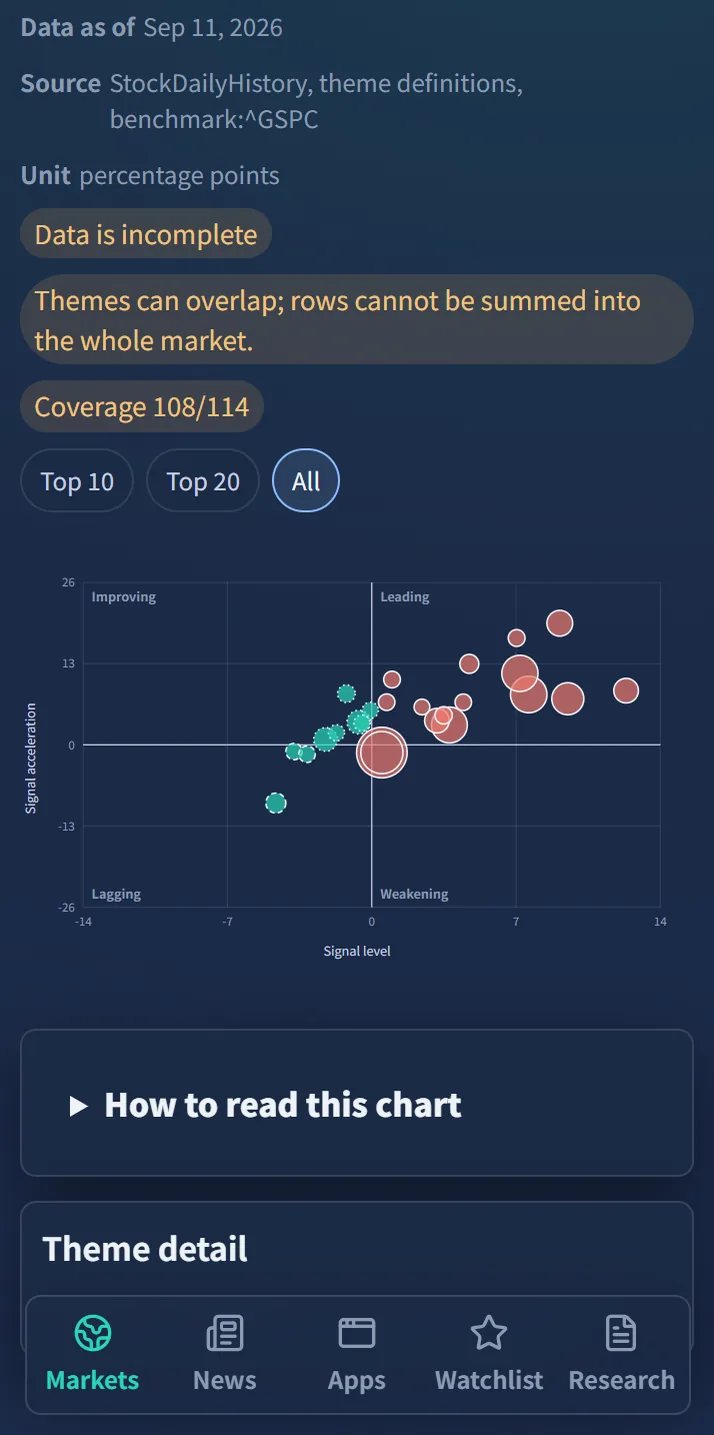
Compare four themes from Sep 04 to Sep 11: moving up and right means strengthening, down and left means weakening.
View the rotation mapSep 04Sep 11
See capital and theme rotation in charts, jump from news to the symbols it mentions, and scan the market with your own conditions.
No credit card. New accounts get a one-time 15-day Pro trial.
Product demo
Feature illustration, not live market data
Compare four themes from Sep 04 to Sep 11: moving up and right means strengthening, down and left means weakening.
View the rotation mapSep 04Sep 11
Feature illustration, not live market data
Read a story: the companies and themes it mentions are highlighted and linked to symbols, and one tap follows later news.
View market newsCloud providers raise capital spending, extending order visibility for TSMC advanced nodes and the AI server supply chain.
✓ Added to watchlist; you will be notified of follow-ups
This is an information link, not a claim that news moved a price.Feature illustration, not live market data
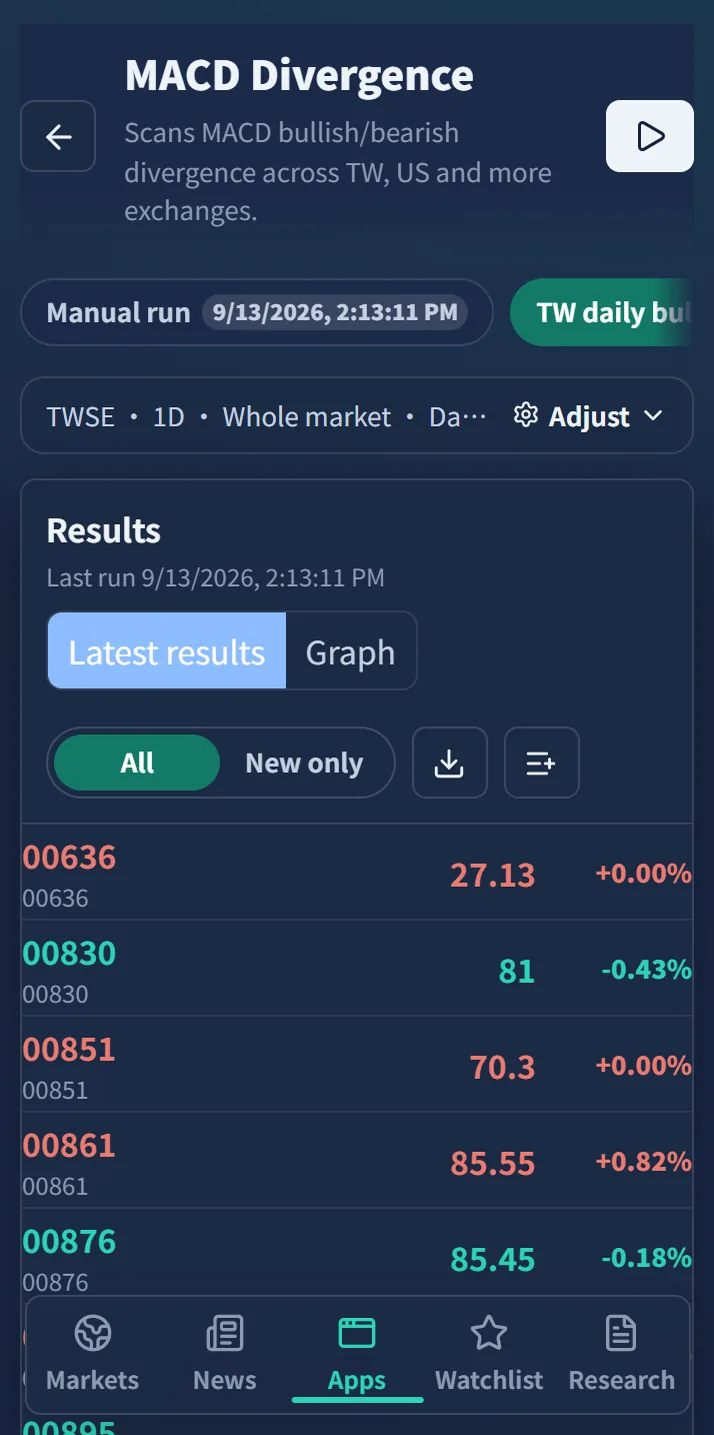
Pick conditions and an exchange, run the scan, and keep only matching symbols with the reason they matched. This demo does not run a scan or deduct credit.
View scanning tools1 Conditions
MACD bullish divergenceVolume expandingTWSE-listed
2 Scan TWSE-listed stocks
3 matches
3 Candidates
Automatic animation is disabled by your system setting; you can still switch and read each example.
Rotation maps, capital-flow quadrants, global liquidity, and financial money-flow charts show where the money is going at a glance.

Every headline is tagged with the symbols and themes it mentions. Follow the ones you care about and get notified when new stories arrive.

Use MACD divergence, price-volume patterns, and field conditions to find matching symbols on the exchange you choose (for example, TWSE-listed stocks), and schedule scans to run automatically.